By Matt Burdett, 31 January 2018
On this page, we look at changes in the global energy balance, and the role of feedback loops, resulting from solar radiation variations, including global dimming due to volcanic eruptions; terrestrial albedo changes and feedback loops; methane gas release and feedback loops.
Evidence of historic climate change
The specific causes of change in the energy budget are explored in more detail in subsequent pages on this site. This page is a general introduction to the issues.
There is a lot of evidence that changes in the energy budget have caused climate change in the past. This occurs over very long time scales ranging from hundreds to millions of years. The evidence includes:
- Glacial mountain landscapes as evidence of Ice ages, and the warming periods that ended them
- Vegetation changes over time (observed from fossilised plant matter)
- The geological record
- Raised beaches and submerged river valleys as evidence of sea level change
The graph below uses data from the European Project for Ice Coring in Antarctica (EPICA). It demonstrates that at various points through the Earth’s history over the past 800,000 years, there have been warming and cooling periods. All but the most recent warming is undoubtedly natural as human society was not advanced enough to have an impact on the climate.

- Graph showing temperature estimates relative to today from over 800,000 years of the EPICA ice cores in Antarctica. Source: Autopilot, 2010.
Temperature variations have occurred on a smaller scale over the past 10000 years, which was when the last ice age ended. The graph below again shows evidence that the global temperature has fluctuated in the long term.

- Graph showing climate variation over millions of years. BP stands for ‘Before Present’ so 12000 BP is equivalent to 10000 BC. Source: Rohde, 2010.
Present-day climate change
However, the rate of temperature change has massively increased in the last two hundred years.
- Despite Subtle Differences, Global Temperature Records in Close Agreement. Source: Voiland, 2011.
This warming period is so much faster than any previous point, and is highly likely to have been caused by human greenhouse gas emissions as shown on the NASA graphic below. This results in the enhanced greenhouse effect in which greater concentrations of greenhouse gases in the atmosphere trap more heat.

- This graph, based on the comparison of atmospheric samples contained in ice cores and more recent direct measurements, provides evidence that atmospheric CO2 has increased since the Industrial Revolution. Source: NASA, n.d.,b.
Climate forcings
The factors that cause changes in the atmosphere are known as ‘climate forcings’. Solar radiation changes, global dimming due to volcanic eruptions, changes in albedo and the release of methane gas are all climate forcings. Though these can all operate over longer periods, the current pace of climate change cannot be explained through these as only naturally occurring phenomena.
The Intergovernmental Panel on Climate Change has undertaken five assessments of the changes in global climate. It is a group of 1,300 independent scientific experts that works under the United Nations. In their most recent assessment, they “concluded there’s a more than 95 percent probability that human activities over the past 50 years have warmed our planet” (NASA, n.d.,a.).
Feedback loops
A feedback loop occurs in a system. Open systems include inputs and outputs. A feedback loop occurs when the outputs feed back into the system and add to the inputs. The diagram below shows a simple feedback loop.
In Geography, a feedback loop is a very similar concept to that of cumulative causation, since a change in one part of the system leads to corresponding changes in other parts of the system. In the study of climate, a feedback loop is an example of a multiplier effect, whereby the initial change leads to changes in other parts of the system which eventually create even more of the same change in the initial stage.
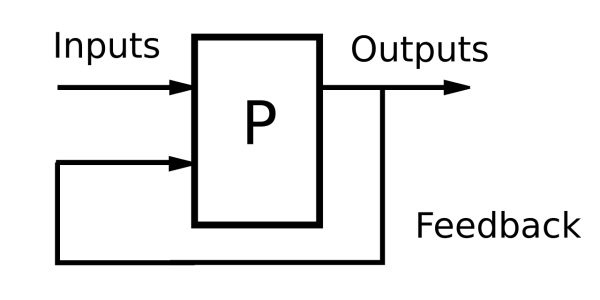
- General Feedback Loop. Source: GliderMaven, 2014.
Feedback loops are especially important when studying the climate, because some changes in the system can lead to the system being reinforced in an ever-stronger cycle. In reality, many of these changes are much more complex than a simple feedback loop.
Solar radiation
The Sun is the main source of energy for the Earth’s climate. The rate of energy release from the Sun is not constant, and can change over short periods.
Sunspots

- Sunspots. Source: Fox, 2011.
A sunspot is the name given to an area of the Sun’s surface that is unusually cool. This reduces the output of energy from the Sun. These sunspots are associated with a solar cycle of roughly 11 years (Fox, 2011) However, the area immediately around the sunspot becomes even hotter than usual. The overall output of energy becomes even higher than usual, so more energy is received by the Earth. This may temporarily raise the temperature of the atmosphere.
As humans have no effect on the Sun, this is a purely natural cause of climate change. However, this isn’t responsible for our current period of climate change. Since 1978 accurate satellite measurement of solar output has shown a very slight decrease in the amount of solar energy from the Sun. Longer term changes are also not able to account for the changes in atmospheric heat over the last few decades. Solar changes could not account for more than 10% of the warming during the 20th century (NASA, n.d.a).
Milankovitch cycles
These are cycles of the Earth’s orbit which position the Earth nearer or further from the Sun and at different angles. The result is that there is more insolation during near periods, which causes higher temperatures.
The gravitational changes in the Earth’s orbit around the sun pull the Earth out of its more regular circular orbit into a more elliptical orbit. This is known as ‘eccentricity’. As the orbit becomes more eccentric (oval shaped), it has periods nearer to the sun which increases the incoming solar energy. There are also changes in the spinning of the Earth known as tilt and precession. These affect the distribution of the incoming insolation and thereby cause climate change.
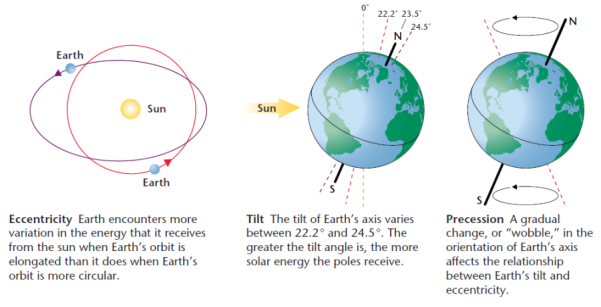
- Milankovitch cycles. Source: Rodborough, n.d.
Note: Each of these is a long term climate forcing. Year on year the variation in eccentricity, tilt and precession is very limited. The season changes in the angle of the Earth to the Sun that cause winter and summer are not responsible for long term climate change.
Global dimming
Global dimming occurs when the atmosphere contains unusually large amounts of particles that block out the Sun’s energy. When this input of energy is reduced, it leads to a lower level of absorption at the Earth’s surface, and therefore a weakened greenhouse effect.
There can be a reverse effect whereby the particles absorb energy directly into the atmosphere (as they themselves become the conductors of longwave radiation). However, this is likely to be outweighed by the role of these particles as hygroscopic nuclei. Hygroscopic nuclei are tiny particles that attract moisture, forming the water vapour droplets that form clouds. Clouds add to the effect of global dimming by reflecting energy out to space.
Global dimming may be caused by volcanic eruptions and, very rarely, massive forest fires those caused by asteroids hitting the Earth. However, humans may also be contributing to the change through the burning of fossil fuels and forests. This can lead to the enhanced greenhouse effect.
An example of the impact of human activities on global dimming was seen after the terrorist attacks on the United States on 11th September 2001. For three days after the attacks, all air traffic in the USA was suspended, so less pollution was added to the atmosphere at high altitudes. The result was a rise in surface temperatures by 1 degree centigrade during the three days (BBC, n.d.).
Albedo
Albedo is a term that describes how reflective a surface is. It more precisely describes how much solar radiation is reflected.
- A surface with a high albedo is one that reflects a lot of light. High albedo surfaces do not absorb much energy. These are generally white or light coloured surfaces. High albedo surfaces include ice, clouds (when viewed from space), and yellow sandy deserts.
- A low albedo surface does not reflect much light. Low albedo surfaces absorb energy. These are generally darker surfaces such as urban areas and water.
Albedo is a system component that can lead to a feedback loop. If there is less ice, then the overall albedo of the Earth will decrease, leading to more absorption of energy. This warms up the atmosphere melting the ice, continuing the cycle. Furthermore, if sea levels rise the water becomes deeper and can absorb more energy, leading to higher temperatures and more sea level rise.
The graph below shows the albedo values of several common surfaces including clouds (cumulus stratus, stratus and altocumulus cirrus).

- Percentage of diffusely reflected sunlight in relation to various surface conditions. Source: Grobe, 2000.
Changes in albedo can be naturally occurring, if the initial change is a natural one (such as a sunspot) which causes a feedback loop.
Changes can also be caused by humans, including the massive changes in land use as forests are removed for farming and urban development. However, urban development is likely to be only a very small contribution to the global climate change we are currently experiencing, since estimates typically put the figure of the total land surface (already less than 30% of the planet’s surface) at between 1% and 3% (Liu et al. 2010). The upper estimates seem like they might have been overstated due to problems with the method of data collection (Cox, 2010).
Methane gas release
Methane is a very powerful greenhouse gas. When it (and other greenhouse gases) are released into the atmosphere, the atmosphere can hold on to more heat.
Methane gas can be released naturally from the decomposition of organic matter in the soil. If the soil has been under permafrost (a permanent state of the soil being frozen) which then melts quickly, the release of gas can be large. This can occur naturally, but also due to human actions speeding up the rate of climate change.
Humans directly contribute to the release of methane through the dairy industry and the cultivation of rice. Rice fields release significant levels of methane while the digestive systems of cattle also release large amounts of methane.

- Global Methane Budget. Source: Global Carbon Project, 2016.
Summary
|
Climate forcing |
Natural, human, or both? |
|
Solar radiation |
Natural |
|
Global dimming |
Both |
|
Albedo |
Both |
|
Methane release |
Both |
Sources
Autopilot, 2010. Temperature estimates relative to today from over 800,000 years of the EPICA ice cores in Antarctica. Available via https://en.wikipedia.org/wiki/Global_temperature_record Accessed 31 January 2018
BBC, n.d. Horizon: Global Dimming: Programme transcript. http://www.bbc.co.uk/sn/tvradio/programmes/horizon/dimming_trans.shtml Accessed 31 January 2018
Cox, 2010. How Much Of The World Is Covered By Cities? http://www.newgeography.com/content/001689-how-much-world-covered-cities Accessed 31 January 2018
Fox, 2011. New Insights on How Solar Minimums Affect Earth. https://www.jpl.nasa.gov/news/news.php?release=2011-181 Accessed 31 January 2018
GliderMaven, 2014. General Feedback Loop. https://commons.wikimedia.org/wiki/File:General_Feedback_Loop.svg Accessed 31 January 2018
Global Carbon Project, 2016. Global Methane Budget http://www.globalcarbonproject.org/methanebudget/index.htm Accessed 31 January 2018
Grobe, 2000. Percentage of reflected sun light in relation to the various surface conditions of the earth. https://commons.wikimedia.org/wiki/File:Albedo-e_hg.png Accessed 31 January 2018
Liu et al. [Lui, He, Zhou and Wu], 2014. How much of the world’s land has been urbanized, really? A hierarchical framework for avoiding confusion. Landscape Ecology Vol 29 pp763-771. https://www.semanticscholar.org/paper/How-much-of-the-world-s-land-has-been-urbanized-re-Liu-He/300e195d7437c894e482ec7aea43d50a5daa5011 Accessed 31 January 2018
NASA, n.d.,a. Is the sun to blame? https://climate.nasa.gov/causes/ Accessed 31 January 2018
NASA, n.d.,b. Graphic: The relentless rise of carbon dioxide. https://climate.nasa.gov/climate_resources/24/ Accessed 31 January 2018
Rodborough, n.d. Milankovitch Cycles. https://rodboroughgeog.wordpress.com/milankovitch-cycles/ Accessed 31 January 2018
Rohde, 2010. Holocene Temperature Variations. Available via https://commons.wikimedia.org/wiki/File:Holocene_Temperature_Variations.png Accessed 31 January 2018
Voiland, 2011. Despite Subtle Differences, Global Temperature Records in Close Agreement. https://www.giss.nasa.gov/research/news/20110113/ Accessed 31 January 2018
Changes in the global energy budget: Learning activities
Questions
- What is the evidence for long term climate change? [4]
- Describe the variation in temperature over the past 800,000 years. [3]
- Describe the variation in temperature over the past 10,000 years. [3]
- Suggest why the term ‘climate change’ is preferred over ‘global warming’. [2]
- How are the concepts of feedback loops and cumulative causation similar? [2]
- Define ‘climate forcing’. [1]
- For each of the following issues, briefly explain how it can cause changes to global temperatures.
- Solar radiation [3]
- Global dimming [4]
- Albedo [3]
- Methane release [3]
Other tasks
For each of the following key climate forcings, complete a brief feedback loop diagram.
- Solar radiation changes
- Global dimming due to volcanic eruptions
- Changes in albedo
- Release of methane gas
The number of steps will vary but it should look something like this:

